
Blog
About
Code
Publications
Consulting
Archive
Current page
Using post-mortem debugging in your workflow
How you can use post-mortem debugging
How it works
How to handle an exception and still allow post-mortem debugging
Post-mortem debugging in IEP
Summary
The power of post-mortem debugging
Post-mortem debugging refers to the concept of entering debug mode after something has broken. There is no setting of breakpoints involved, so it's very quick and you can inspect the full stack trace, making it an effective way of tracing errors.
This post explains some of the benefits and how it can be used from IEP and other environments.

Image by Rembrandt (public domain), via Wikimedia Commons
Using post-mortem debugging in your workflow
If you have an error in your code, there are several ways to debug:
- Trial and error: modifying a suspicious piece of code.
- Add
print(x)to your code to see the value of important objects. - Set breakpoints.
- Post-mortem debugging.
These approaches do not exclude one-another, and I often use a combination of methods to find the source of a problem.
The greatest benefit of post-mortem debugging is that you can use it directly after something has gone wrong. With all other methods, we must first find out where (approximately) the error occurred, so that we can place our breakpoints or print-statements at the proper location.
I have post-mortem debugging bound to CTRL-P in IEP; as soon as I see
a red traceback appearing in the shell, I press the shortcut and I
immediately see what went wrong and where. In some cases the error can
be fixed at once. In some cases not, and I need some of the other
methods too.
In most environments the experience is quite similar to debugging with breakpoints, except you don't have to set breakpoints. Apart from not being able to continue execution using step/step-in/continue, you can inspect the namespace of all frames in the call stack. And you can run code in these namespaces as usual (e.g. to test whether a modified version of the offending line would work correctly).
How you can use post-mortem debugging
Post-mortem debugging is a method that requires an environment that provides dynamic execution of code. When an error occurs in such an environment, rather than stopping the process, an error message is displayed and the process returns to a REPL (interactive prompt) of some kind. As such, it is a method that works mostly with dynamic languages.
Whether or not you can use this method depends on the environment and the available tools. Here's a (very incomplete) list:
- In IEP, click
shell > Postmortem: debug from last traceback. You can bind it to a key-combination for easier access. - The builtin Python debugger can enter post-mortem debugging using
pdb.pm(). - Matlab can be configured to enter post-mortem debug mode when an exception occurs.
- (let me know if you how to use it in other environments)
How it works (in Python)
Python has special placeholders for the last exception that occurred in
sys.last_traceback, sys.last_value and sys.last_type. A debugger
can grab these (especially the last_traceback to reconstruct the call
stack up until the point where the exception was raised.
The sys.last_traceback object is an object that can be used to
traverse through all frames on the call stack. These frames are
essentially a snapshot of the execution state of your program at the
moment that the exception occurred; the local variables in each function
up until the exception can be inspected. (A side effect of this is that
any (possibly large) objects that are present in the call-stack are not
cleaned up.)
So where do get these sys.last_* get their values from? When an
exception falls all the way through (i.e. an unhandled exception) the
interpreter catches it. It sets these values, and prints out the
familiar (red) error message to the shell.
When a debugger wants to enter post-mortem debugging, it can use
the sys.last_* variables to gain access to all there is to know about
that particular exception.
How to handle an exception and still allow post-mortem debugging
Sometimes you want to handle an exception by printing a warning/error, but still allow entering post-mortem debugging for that error. This can be particularly useful for event-driven applications (we use it in some parts of vispy too).
The function to use is sys.exc_info(). It should be called in the
scope where an exception is handled, and then returns information about that
exception. To handle an exception and still allow post-mortem debugging, you
can use the following code:
try:
    ...
except Exception:
    # get traceback and store (for post-mortem debugging)
    type, value, tb = sys.exc_info()
    tb = tb.tb_next # Skip *this* frame
    sys.last_type, sys.last_value, sys.last_traceback = type, value, tb
    del tb  # Get rid of it in this namespace
    # Now do however you wanted to handle the error
    ...
Post-mortem debugging in IEP
Until late 2013, IEP did not support breakpoints. But it has had
post-mortem debugging for a long time. The suggested means of debugging
was to place 1/0 in your code, so that you can quickly go to a certain
position and inspect the stack trace. IEP now does have breakpoints,
which are definitely an enrichment, but not a replacement for
post-mortem debugging.
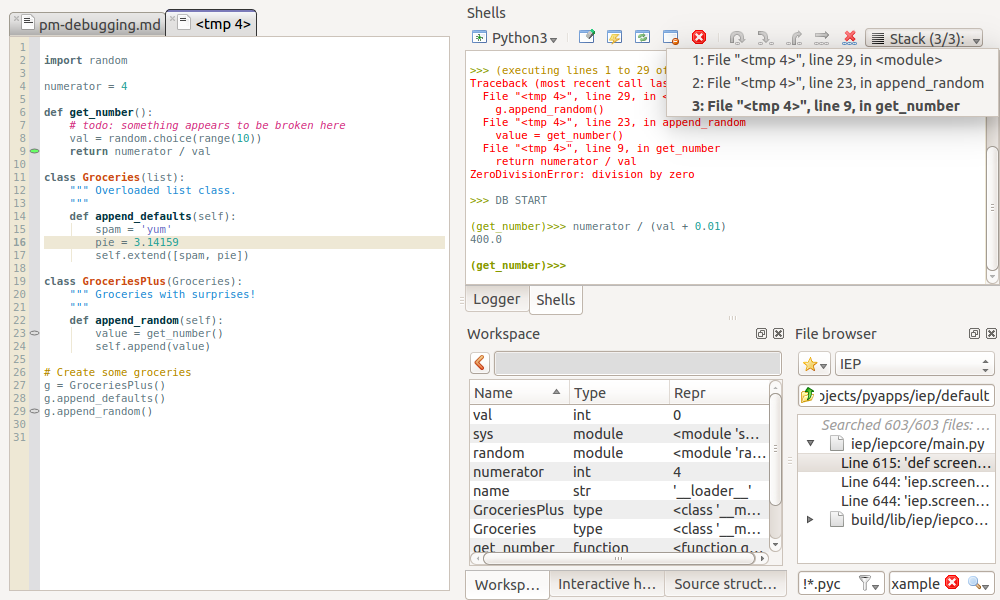
Once in debug mode, the shell will move to the top frame of the stack and the editor will open the associated file at the right line number. In the shell widget, you can use the stack button to easily navigate through the frames. Click the little cross to the left of it to exit debug mode. (See the image near the top of this article.)
Summary
Post-mortem debugging is a simple and very quick way to start the debugging process, and it's easy to use from IEP.